¶ Prerequisites
¶ Create Your Own Experiment
Every attendee can create an experiment with Renew-Simulation profile.
This experiment will be used in all hands-on sessions on Thursday. It contains pre-loaded datasets for simulation and data analysis. These datasets can also be found here.
It takes about 40 minutes to initialize the experiment. Please start the experiment before the hands-on sessions.
¶ Open VNC Remote Desktop
When your experiment status is ready, click on Open VNC Window in the gear icon menu.

¶ Sounder Hands-on Experiments (H11)
¶ Sounder Channel Measurement
To use the RF equipment, create an experiment with Renew profile and check “Attach … on same network interface”.
Open the VNC window of pc1 (d840).
To run Sounder measurement, run the following command in /scratch/repos/RENEWLab/CC/Sounder directory:
./build/sounder --conf_file [path/to/json/file]For example,
./build/sounder --conf_file files/powder-1u-pilot.jsonFor configs with payload data, you need to generate data using --gen_data_bits flag before measurement. For example,
./build/sounder --conf_file files/powder-1u-ul-data.json --gen_data_bits
./build/sounder --conf_file files/powder-1u-ul-data.json
¶ Analysis of Data Collected by Sounder
Your own experiment has a pre-loaded dataset collected by Sounder in /scratch/renew_dataset/sounder. The dataset can also be found here.
To fast check the data collected by Sounder, run the following command in /scratch/repos/RENEWLab/PYTHON/IrisUtils directory:
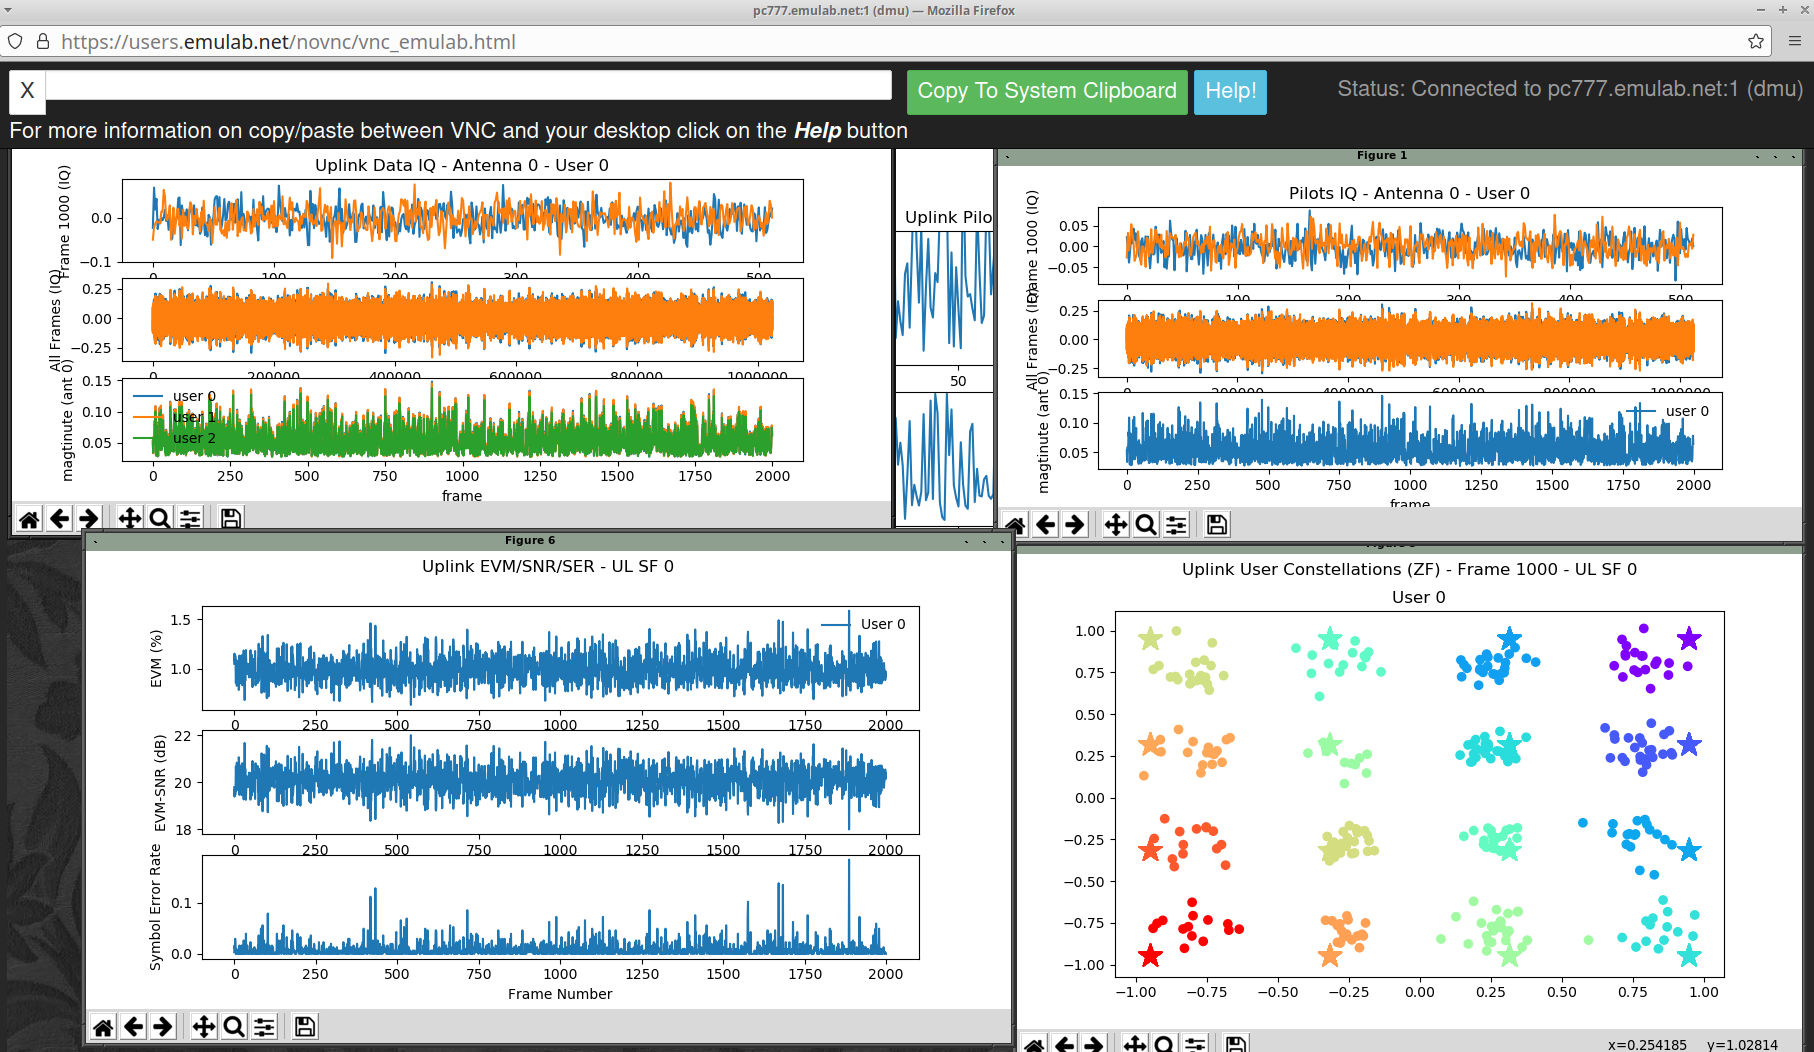
python3 plot_hdf5.py [/path/to/hdf5/file]For example,
python3 plot_hdf5.py /scratch/renew_dataset/sounder/trace-uplink-2023-1-22-16-59-54_1_36x4_0_35.hdf5To perform a more thorough deep inspection of the dataset to verify the integrity of the data, run the following (may take a couple of minutes):
python3 plot_hdf5.py /scratch/renew_dataset/sounder/trace-uplink-2023-1-22-16-59-54_1_36x4_0_35.hdf5 --deep-inspectThe demodulation option will show the constellation and symbol error rate (takes longer):
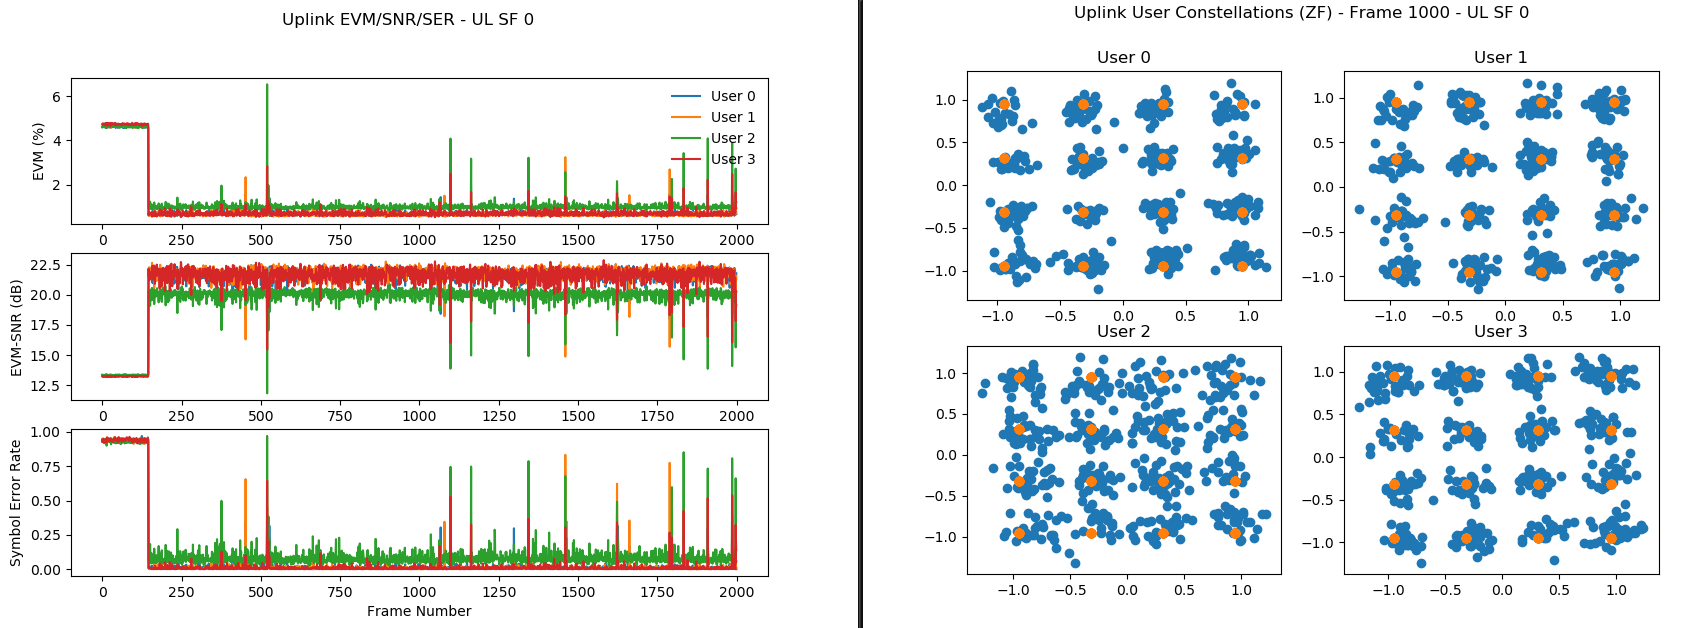
python3 plot_hdf5.py /scratch/renew_dataset/sounder/trace-uplink-2023-1-22-16-59-54_1_36x4_0_35.hdf5 --analyzeThe demodulation option will show the constellation and symbol error rate (takes longer):
python3 plot_hdf5.py /scratch/renew_dataset/sounder/trace-uplink-2023-1-22-16-59-54_1_36x4_0_35.hdf5 --demod=zf

¶ Agora Hands-on Experiments (H12)
¶ Agora Simulation
¶ Basic Setup
Server: d430 in Renew-Simulation experiment
Sample rate: 1 Msps
Topology: 32 base station antennas + 4 users
¶ Uplink Experiment
To start the experiment, run the following commands in the agora directory:
./test/sim_tests/ul-mww-sim.sh
¶ Downlink Experiment
To start the experiment, run the following command in the agora directory:
./test/sim_tests/dl-mww-sim.sh¶ Combined Uplink and Downlink Experiment
To start the experiment, run the following command in the agora directory:
./test/sim_tests/uldl-mww-sim.sh
¶ Agora Over-the-air
¶ Basic Setup
To use the RF equipment, create an experiment with Renew profile and check “Attach … on same network interface”.
Server: d840 (pc1)
Sample rate: 7.68 Msps
RF Frequency: 3.545 GHz
Uplink Topology: 36 base station antennas + 4 users
Downlink Topology: 18+1 base station antennas (including a calibration radio) + 2 user
¶ Uplink Experiment
1. Single-user experiment. Run the following commands in two terminals in the agora directory:
In Terminal 1:
./build/user --conf_file files/config/examples/ul-mww-1ue.json
In Terminal 2:
./build/agora --conf_file files/config/examples/ul-mww-1ue.json2. Two-user experiment. Run the following commands in two terminals in the agora directory:
In Terminal 1:
./build/user --conf_file files/config/examples/ul-mww-2ue.json
In Terminal 2:
./build/agora --conf_file files/config/examples/ul-mww-2ue.json
¶ Downlink Experiment
1. Single-user experiment. Run the following commands in two terminals in the agora directory:
In Terminal 1:
./build/user --conf_file files/config/examples/dl-mww-1ue.json
In Terminal 2:
./build/agora --conf_file files/config/examples/dl-mww-1ue.json2. Two-user experiment. Run the following commands in two terminals in the agora directory:
In Terminal 1:
./build/user --conf_file files/config/examples/dl-mww-2ue.json
In Terminal 2:
./build/agora --conf_file files/config/examples/dl-mww-2ue.json
¶ Visualization of PHY Stats
¶ Offline Visualization
To plot PHY stats after the experiment finishes, run the following commands in /scratch/repos/agora directory:
python3 tools/python/plot_csv.py 1000 'Frame' '[Data_Name]' 'User' < [/path/to/csv_file]For example,
python3 tools/python/plot_csv.py 1000 'Frame' 'Uplink EVM (%)' 'User' < /scratch/renew_dataset/agora/ul-mww-2ue/log-evm-BS.csv
python3 tools/python/plot_csv.py 1000 'Frame' 'Downlink EVM (%)' 'User' < /scratch/renew_dataset/agora/dl-mww-2ue/log-evm-UE.csv
python3 tools/python/plot_csv.py 1000 'Frame' 'Downlink BER' 'User' < /scratch/renew_dataset/agora/dl-mww-2ue/log-ber-UE.csv
python3 tools/python/plot_csv.py 1000 'Frame' 'Uplink Pilot SNR (dB)' 'User' < /scratch/renew_dataset/agora/ul-mww-2ue/log-plt-snr-BS.csvThe datasets can be found here.
¶ Runtime Visualization
To plot PHY stats at runtime, run the following command in /scratch/repos/agora before starting the experiment:
nc -u -l [Port_Number] | python3 tools/python/plot_csv_rt.py [Max_Frames] [Y_Axis_Max] [Refresh_Rate] 'Frame' '[Data_Name]' 'User'For example,
nc -u -l 33306 | python3 tools/python/plot_csv_rt.py 1000 20 10 'Frame' 'Uplink EVM (%)' 'User'
./test/sim_tests/ul-mww-sim.sh
nc -u -l 33406 | python3 tools/python/plot_csv_rt.py 1000 20 10 'Frame' 'Downlink EVM (%)' 'User'
./test/sim_tests/dl-mww-sim.sh
¶ List of PHY stat data
| Filename | UDP Port Number | Direction | Data Explanation |
|---|---|---|---|
| log-ber-BS.csv | 33309 | Uplink | Bit Error Rate (BER) per user |
| log-ber-UE.csv | 33409 | Downlink | |
| log-ser-BS.csv | 33310 | Uplink | Symbol Error Rate (SER) per user |
| log-ser-UE.csv | 33410 | Downlink | |
| log-csi-BS.csv | 33311 | Uplink | Channel State Information (CSI) condition per subcarrier sample |
| log-csi-UE.csv | 33411 | Downlink | CSI magnitude per subcarrier sample |
| log-evm-BS.csv | 33306 | Uplink | Error Vector Magnitude (EVM, %) per user |
| log-evm-UE.csv | 33406 | Downlink | |
| log-evm-sc-BS.csv | 33307 | Uplink | EVM per subcarrier sample per user |
| log-evm-sc-UE.csv | 33407 | Downlink | |
| log-evm-snr-BS.csv | 33308 | Uplink | Signal-to-Noise Ratio (SNR, dB) derived from EVM per user |
| log-evm-snr-UE.csv | 33408 | Downlink | |
| log-bf-noise-UE.csv | 33405 | Downlink | Noise level (linear scale) in beamforming pilots per user |
| log-bf-rssi-UE.csv | 33404 | Downlink | Received signal strength level (linear scale) of beamforming pilots per user |
| log-bf-snr-UE.csv | 33403 | Downlink | SNR (dB scale) of beamforming pilots per user |
| log-plt-noise-BS.csv | 33302 | Uplink | Noise level (linear scale) in common pilot symbols per user-basestation antenna pair |
| log-plt-rssi-BS.csv | 33301 | Uplink | Received signal strength level (linear scale) of common pilot symbols per user-basestation antenna pair |
| log-plt-snr-BS.csv | 33300 | Uplink | SNR (dB scale) of common pilot symbols per user-basestation antenna pair |
¶ Post-processing HDF5 data collected by Agora
In /scratch/repos/agora/tools/python directory, run
python3 plot_hdf5.py [/path/to/hdf5/file] --demod=zfFor example,
python3 plot_hdf5.py /renew_dataset/agora/agora_hdf5_log/trace-uplink-2023-1-25-14-33-38_1_32x1.hdf5 --demod=zf
