Agora is a complete software realization of real-time massive MIMO baseband processing.
Some highlights:
- Agora currently supports 64x16 MU-MIMO (64 RRU antennas and 16 UEs) with 20 MHz bandwidth and 64QAM modulation, on a 36-core server with AVX512 support.
- Agora is configurable in terms of numbers of RRU antennas and UEs, bandwidth, modulation orders, LDPC code rates.
- Agora supports an emulated RRU and UEs with a high-performance packet generator.
- Agora has been tested with real RRUs with up to 64 antennas and up to 8 UEs. The RRU and UE devices are available from Skylark Wireless.
For the most up-to-date information on the Agora framework, including instruction on how to get started, please refer to the code repository README and the Agora section in our Software Architecture wiki page.
¶ Pre-Requisites
In contrast to RENEWLab, Agora requires more advanced knowledge of the different tools needed to utilize it:
- Advanced knowledge of wireless communications.
- Intermediate knowledge of Linux and command-line interface (CLI).
- Advanced knowledge of C++.
- Intermediate knowledge of Intel intrinsic instructions (only needed if working with certain functional blocks).
- Familiar with JSON file format (used for configuration).
- Familiar with Git.
¶ Agora on Powder
Refer to the powder quick start guide located here
¶ Getting Started
¶ Agora Demo: Uplink mMIMO Multi-User
Description: Continuous transmission from N_UE clients to N_BS_NODE base station radios using Agora. We define two modes: OTA (Over-the-air) and SIM_MOD (simulation). In simulation mode we simply use a Rayleigh channel whereas the OTA mode relies on the Iris hardware for transmission and reception. In both cases the clients transmit an OFDM signal that resembles a typical 802.11 WLAN waveform. A schedule is specified to tell all clients when to transmit in a frame. In each frame, the base station initiates the schedule by sending a beacon signal that synchronizes clients. After that, all clients will transmit simultaneously. The same schedule is repeated as continuous frames until the maximum frame number is reached. We implement a frame structure that allows the base station to capture clean (non-overlapping) training sequences for equalization and demultiplexing of the concurrent data streams.
Instructions:
First, build Agora:
mkdir build
cd build/
cmake .. -DUSE_SPDLOG=True -DENABLE_CSV_LOG=True
make -j
cd ..Next, change the serial numbers of the boards you want to use and adjust the gains. Here are the example config file and topology file tested on POWDER MEB nodes. Then, generate data files:
./build/data_generator --conf_file path/to/config.jsonNow, we are ready to start the Agora clients:
./build/user --conf_file path/to/config.jsonAfter the clients terminal is steady, start the Agora base station in another terminal:
./build/agora --conf_file path/to/config.jsonAgora base station will log uplink statistics into CSV files (e.g., log-evmsnr-BS.csv and log-ber-BS.csv). When the transmission is finished, we can load the CSV files and plot the data using Python or Matlab.
56x8 Uplink Demo:
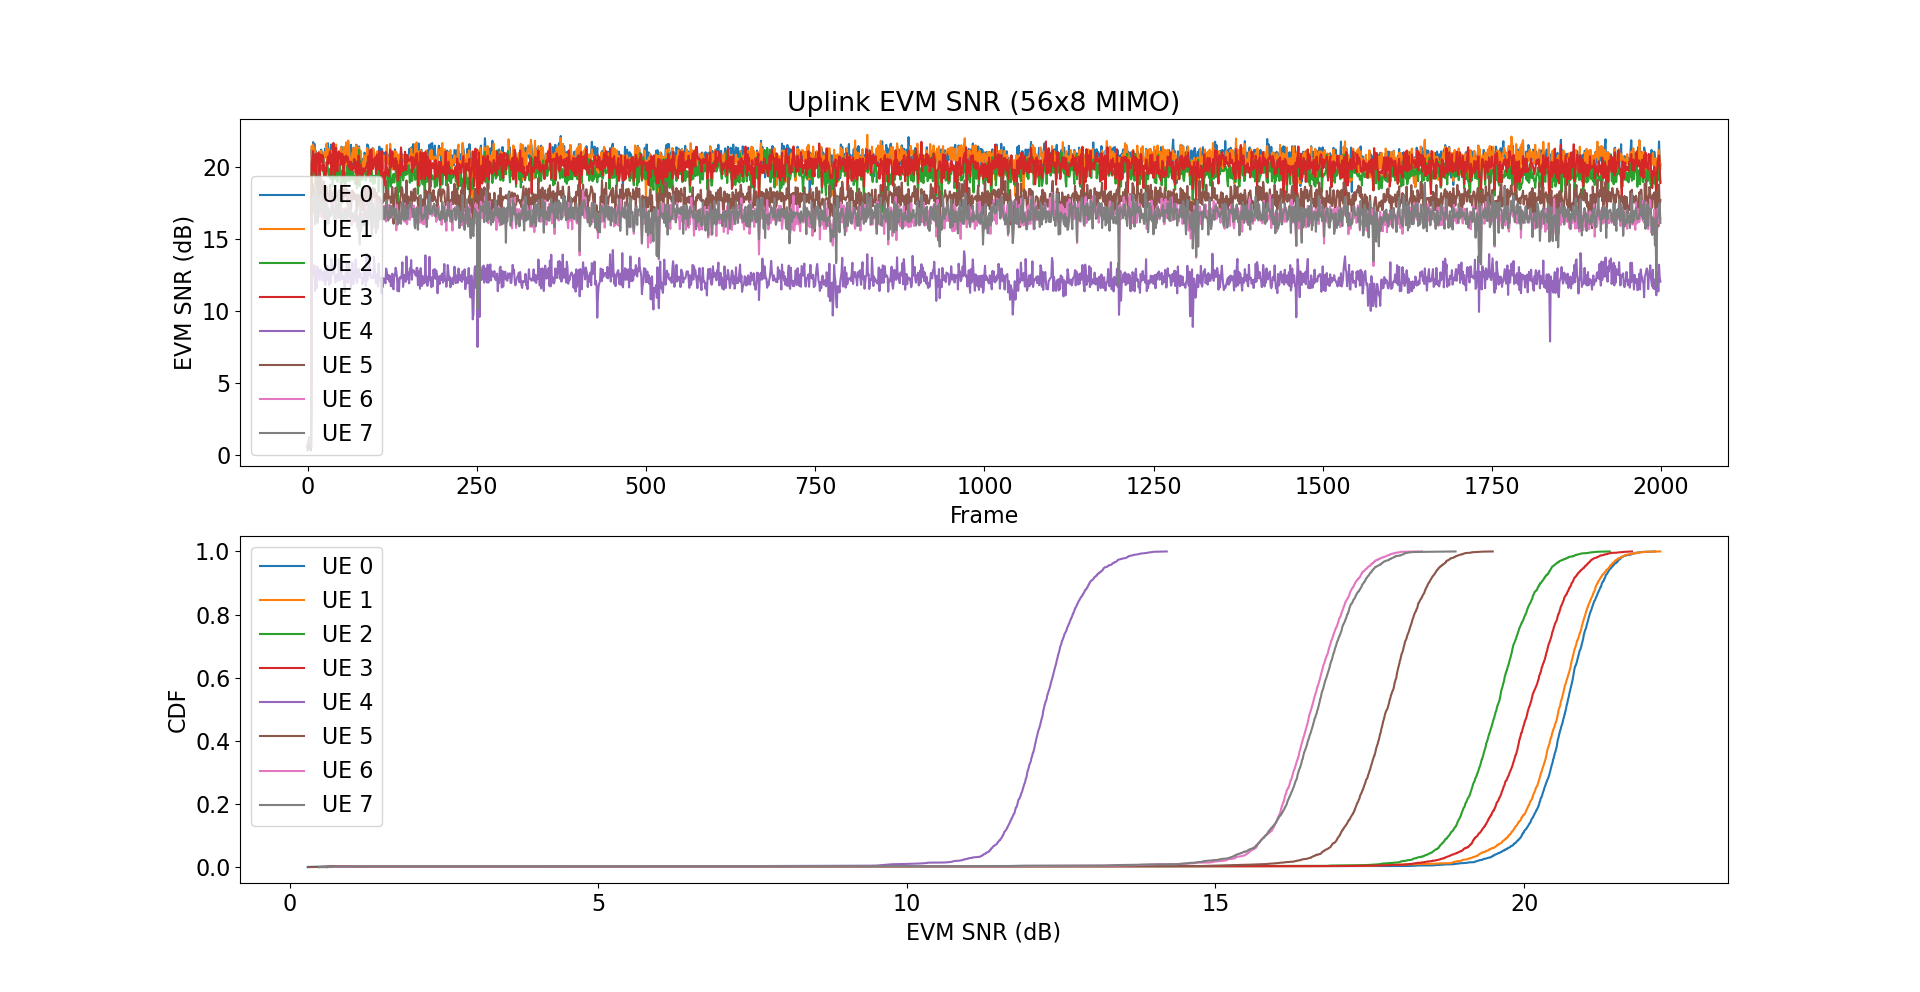
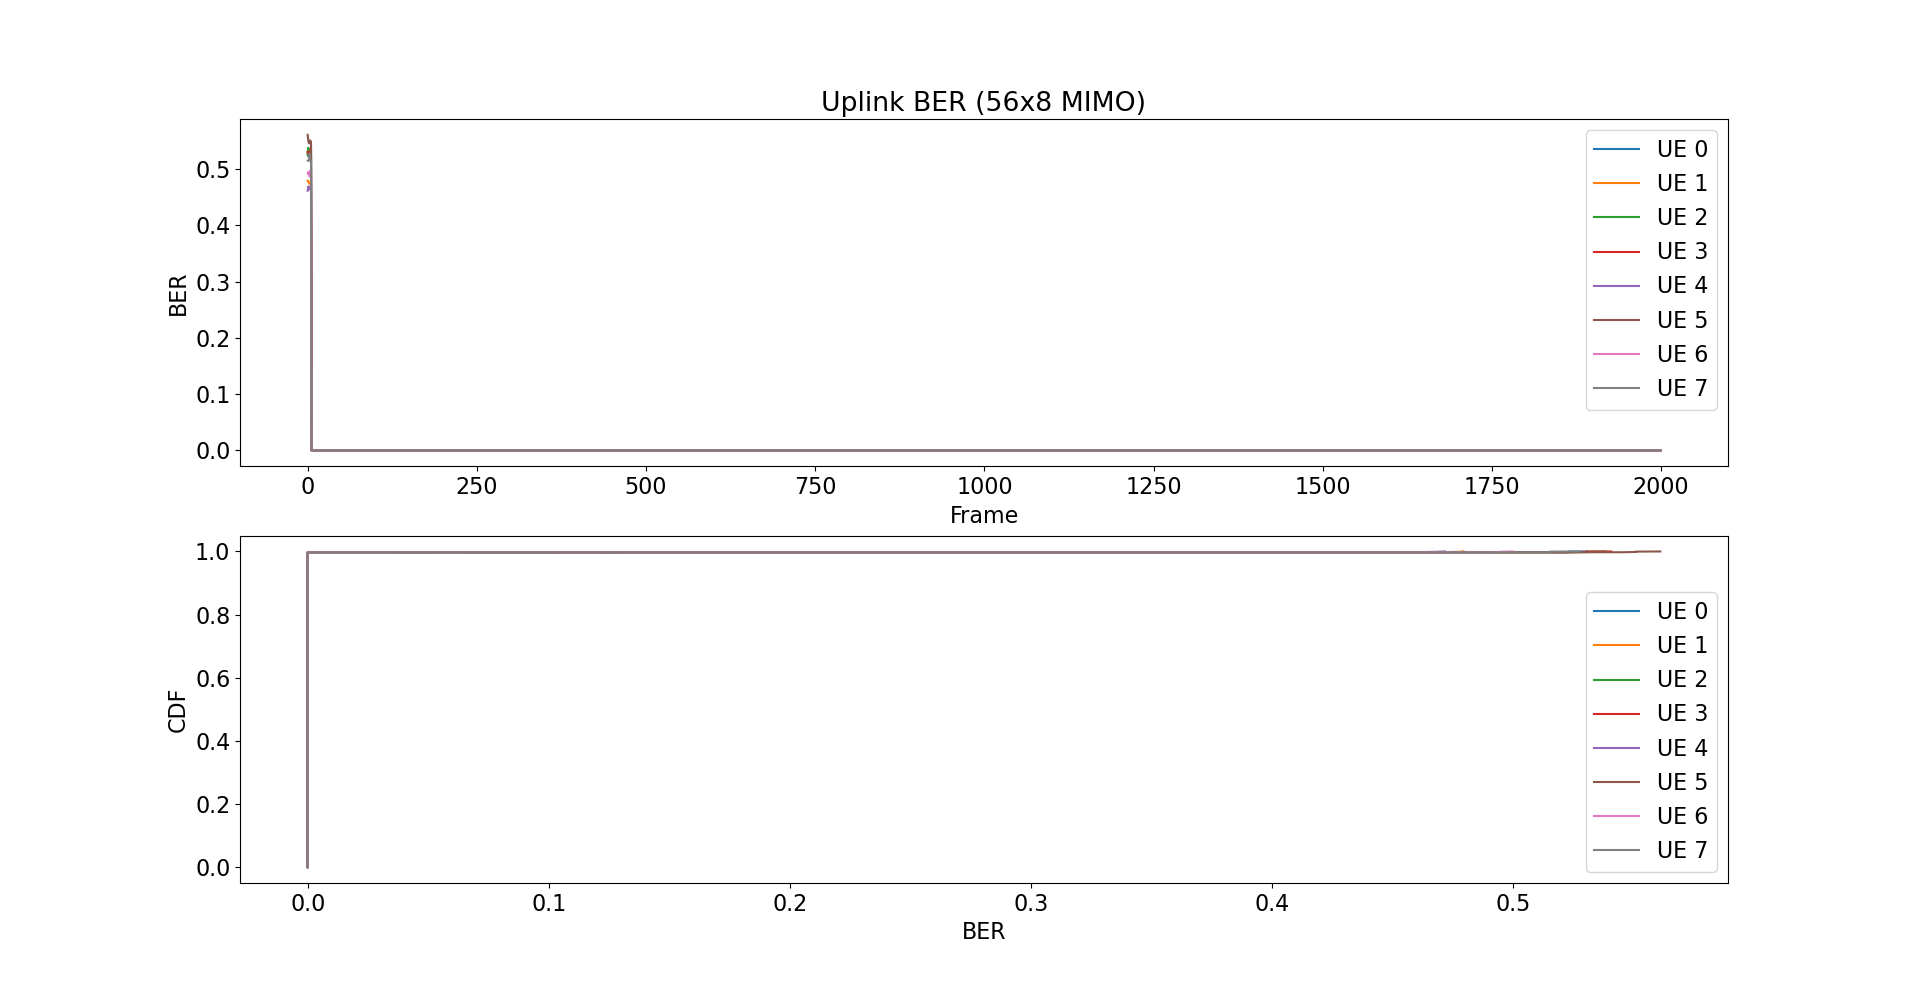
In this example, we run a test using 56 BS antennas and 8 UE antennas on POWDER MEB based on the example config file. Then, we use a Python script to plot the collected CSV data. We run the following commands to plot the collected EVM SNR (Error-Vector-Magnitude Signal-to-Noise Ratio) and BER (Bit Error Rate):
python3 plot_csv.py < 2022-11-1-18-41-7/log-evmsnr-BS.csv 2000 'Frame' 'EVM SNR (dB)' 'UE'
python3 plot_csv.py < 2022-11-1-18-41-7/log-ber-BS.csv 2000 'Frame' 'BER' 'UE'After each command, a figure is shown for the performance statistics of each user. The upper subfigure shows the data over frames and the lower subfigure shows the statistical CDF.


26x4 and 30x4 Uplink Demo:
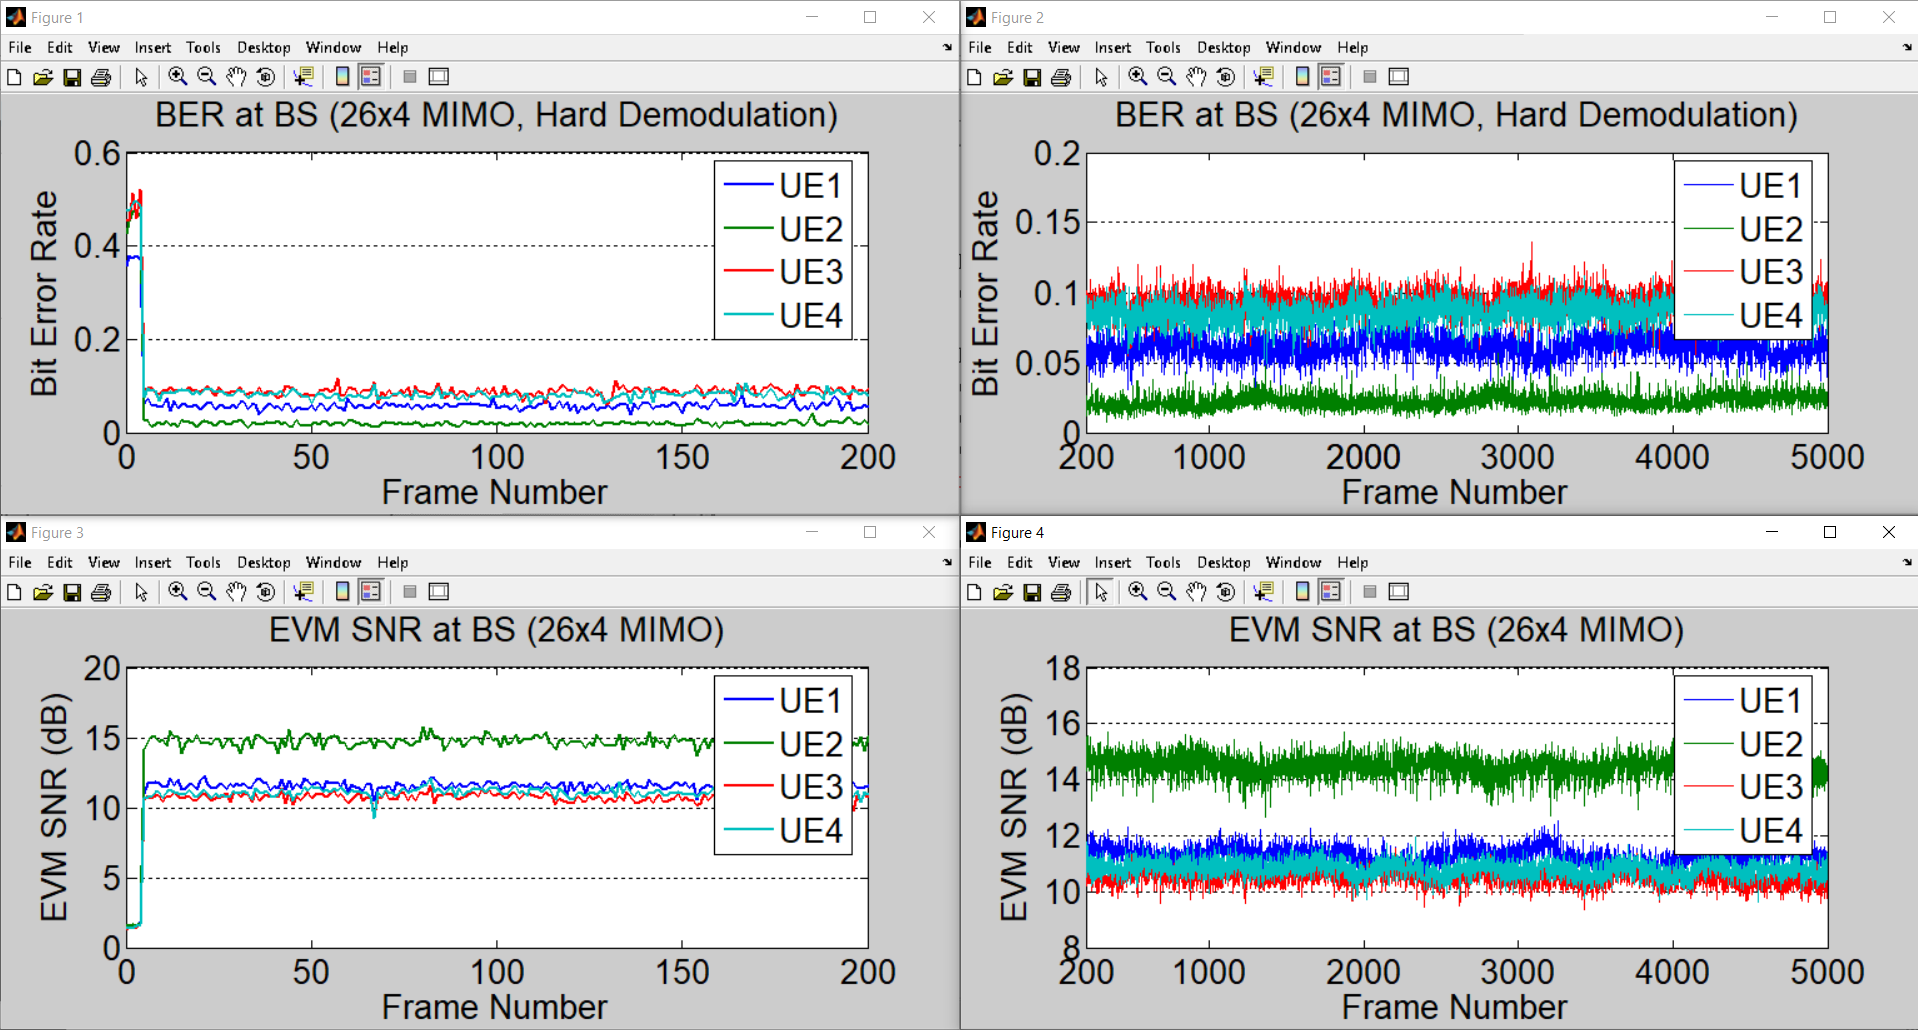
We can also process and plot the collected CSV data in Matlab. In this example, we run a test with 26 BS antennas and 4 UE antennas using hard demodulation and plot the CSV data in Matlab. The overall uplink BER for each UE is 0.061, 0.022, 0.093, and 0.086. We observe high BER and low EVM SNR in the beginning frames when Agora is being initialized, which is an expected behavior to stabilize.

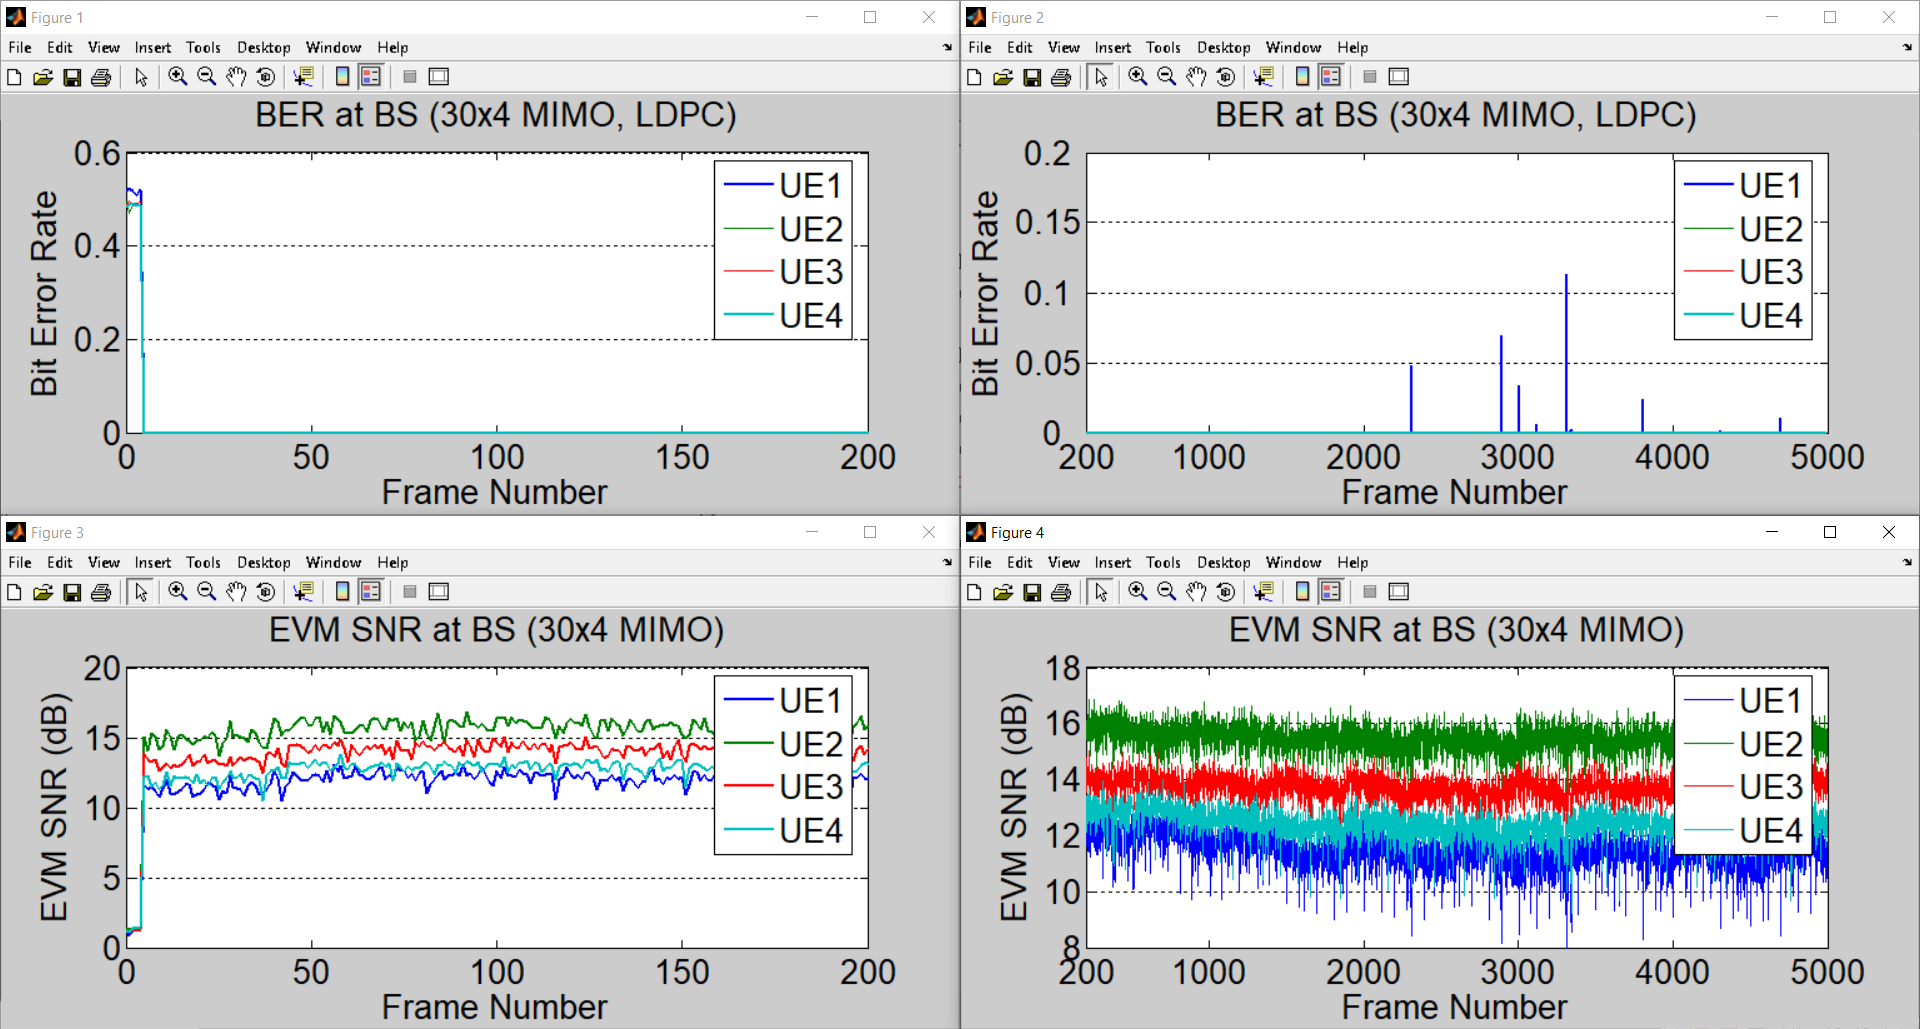
In the next example, we run a test with a different set of 30 BS antennas and 4 UE antennas using LDPC channel coding. The overall uplink BER for each UE is 0.00058, 0.00048, 0.00049, and 0.00049. The BER in most frames is zero thanks to LDPC.
